TED Talk
Jonae Johnson
Ms. I
Statistics
15 January 2017
How Does the Age of First Marriages Affect the Total Number of New Births ?
As of today the population size for Japan is 127.3 million people, and Sri Lanka’s population is 20.48 million. Sri Lanka is a lot smaller than Japan is, but they both are pretty small compared to other countries. A lot of the families in Japan live in a middle class life style. Most families in Sri Lanka were lower class. Throughout the years as the age of first marriage increased the numbers of new birth stayed the same in Japan and in Sri Lanka.
Over the years in the population for Japan has increased at a steady rate. There life expectancy rate in the year of 2012 is 83 years old. In japan women first marriage was at the age 30. The average family would have up to at least two kids. This all is important because without this information we would have reason for why the new birth rate is where it is. The new birth rate at the age of first marriage has been steady over the past century.
Sri Lanka is a pretty small country compared to a lot of other countries. There life expectancy rate is around 75 years old. Sri Lanka average age for first marriage is between the age of 18 and 25. The average family has about three kids per household. This important to know because it will help understand why Sri Lanka has a steady rate for new birth rate.
These two countries are similar in some ways, both countries are about 4,000 miles from each other. Both countries use to have assigned marriages, where they would set their children up to be married.
The two countries have more difference than similarities. Sri Lanka is smaller than Japan. They always married their kids at young age. Most of the families in Sri Lanka are lower class compared to Japan where a lot of the families are middle class.

The x axis is represented by the age of 1st marriage, women. The y axis is represented by the new births in that country. In the second graph I focused more on Japan and Sri Lanka. This is a no correlation. The size of the bubbles represent the population size. The color represent the different countries. Looking at the graph the countries over time are staying constant in the numbers of new births. The countries mostly steady throughout the years. Sri Lanka had a jump in 1800 when the birth rates increased. Japan age at first marriage jumped back a couple of years around the year 1800. The age of first marriage began to get older and older. The birth rate however continue to stay relatively normal. It slight decreased in Japan. In Sri Lanka in the year of 1883 the age of first marriage increased to 17 years old, the birth rate increased also. I found that when people got older and got married they began to have more kids. In Japan the older they got the less kids they decided to have.
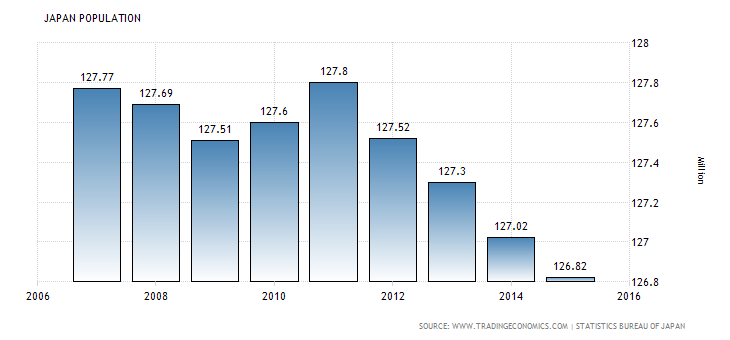
This is the population of Japan over the past 10 years. The population has not been at a steady rate. Around 2009 the population decreased a little. From 2012 until now the population continued to decrease, and shows not effort to increase.

Comments
No comments have been posted yet.
Log in to post a comment.